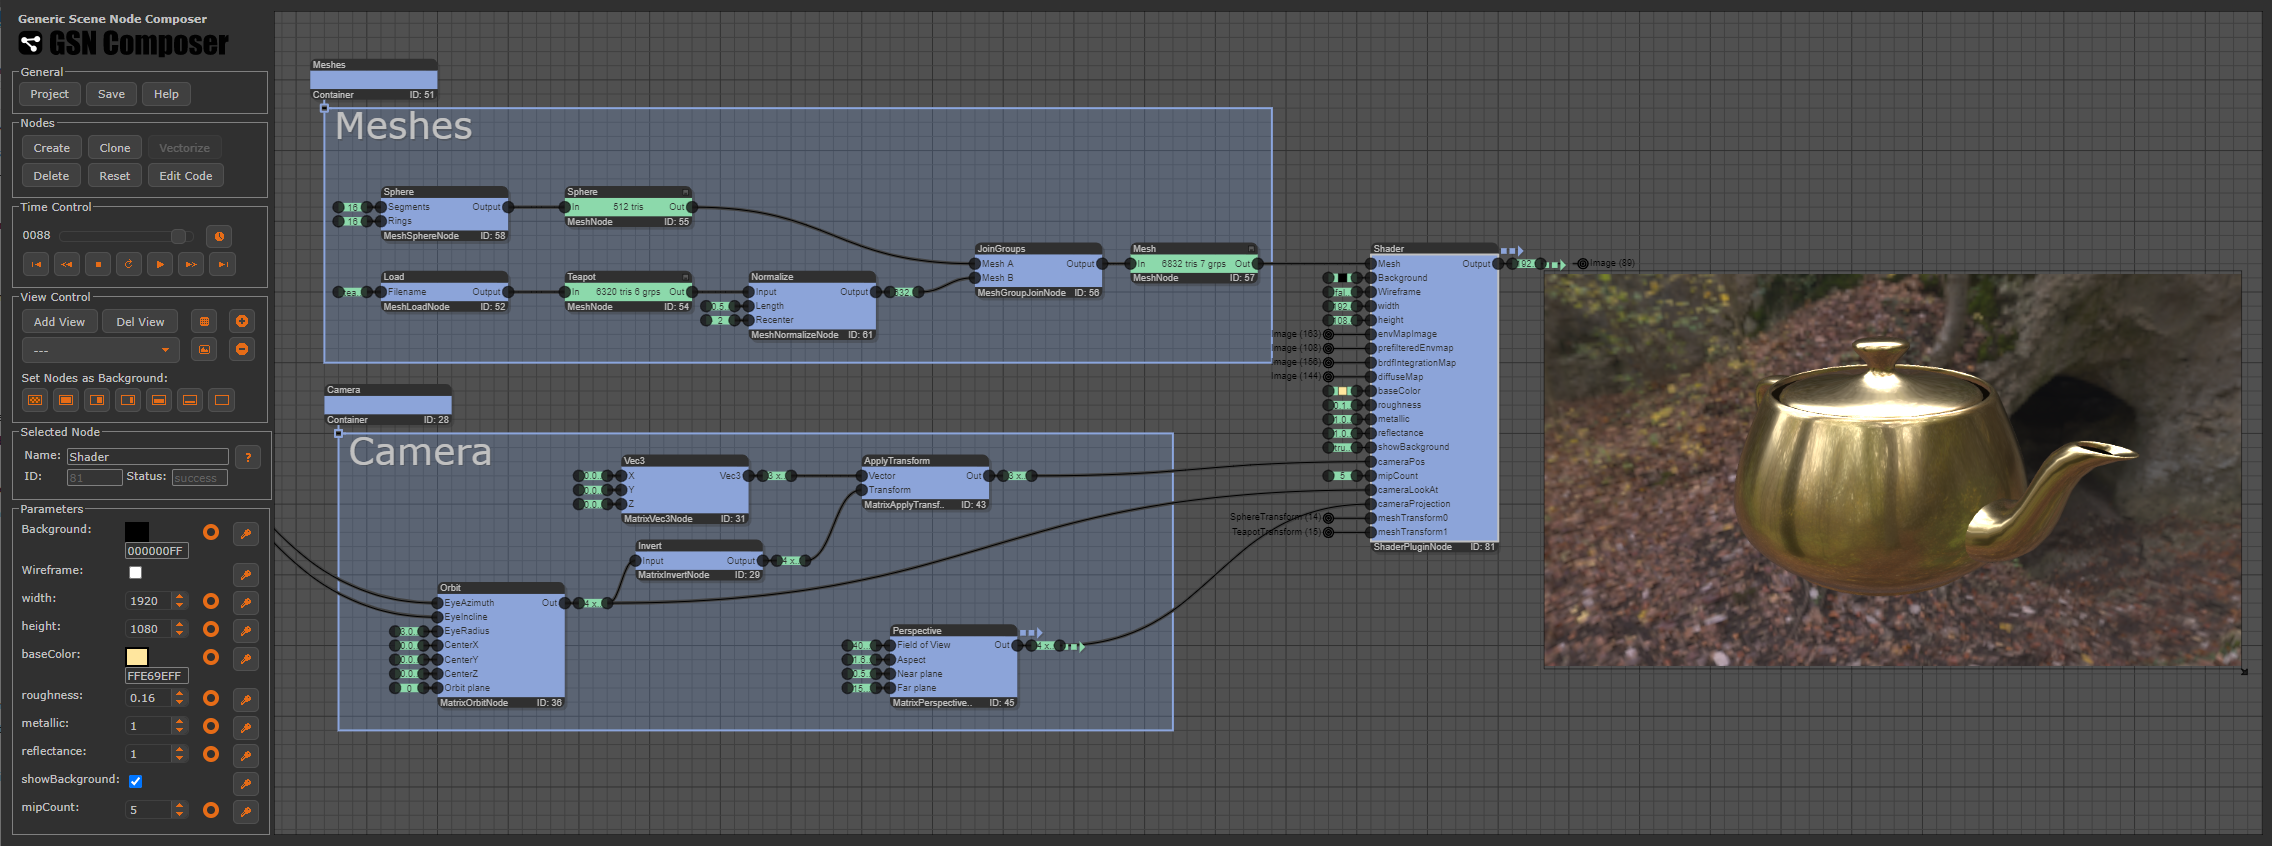
The Generic Scene Node Composer is a web application intended for rapid prototyping and interactive demonstrations. Typical areas of use include education, research, entertainment, special effects, and artistic designs.
The core is the Generic Scene Node Library that provides so-called "nodes", which are small independent software components written in JavaScript. The GSN Composer is an interactive visual editor that allows creating and connecting these nodes to a graph. A generated graph is monitored for modifications of a node and a change is automatically propagated through all the other nodes of the graph.
Typically each node performs only a comparably small task. By combining several nodes into a graph, a user can easily create novel functionality and can rapidly develop new applications. Thus, the GSN Composer can be seen as a visual flow-based programming environment, which is similar in spirit to other interactive node-based approaches, such as: Nuke, LabView, Max/MSP, Pure Data, vvvv, TouchDesigner, NoFlo, Max Creation Graph, Unreal Blueprints, Blender Shader Nodes, ThreeNodes.js, etc.
In the GSN library, there are two basic kinds of nodes: compute nodes and data nodes.
- Data nodes store data. They have a green color.
- Compute nodes process data. To this end, compute nodes read information from the data nodes at their input slots and write their computed result to the data nodes at their output slots. Compute nodes have a blue color.
As a simple example, below is a very small graph that adds two numbers:
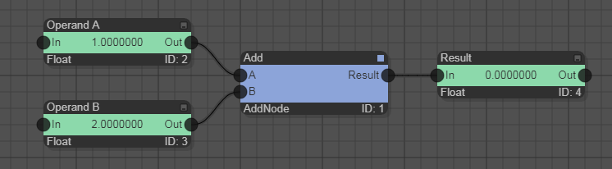
The two input data nodes are the ones on the left side with the value 1.0 and 2.0. The compute node is the blue node in the middle that performs the addition. The output data node is the one on the right, which gets assigned the value 3.0 = 1.0 + 2.0.
Compute and data nodes must alternate in the graph. This means that a compute node cannot be connected to another compute node. Instead, a data node must be placed in between.
To trigger the graph evaluation, the time in the time control panel must be changed. Typically, pressing the play button in the time control panel is a good way to explore the functionality of a given graph.
Hopefully, the user interface of the GSN Composer is intuitive enough that this brief introduction is sufficient for your first experiments. If needed, more detailed information is provided on the getting started page. Looking at existing examples is another way to start using the application. An empty GSN Composer can be launched by following this link: